Showing posts with label analysis. Show all posts

04 July 2016

Ferrari's Melbourne strategy goof-up

Possibly Sebastian Vettel's tire blow-up was just bad luck, but in Austria Ferrari again failed to translate the potential of the car into good results. Again they were beaten by a Red Bull and, of course, a Mercedes. Canada and Spain were also missed opportunities. Ferrari could have won those races, but their strategy failed to deliver the desired result, which has been all too ofthen the case this year.

It all started in Australia, which was possibly the most obvious strategy goof-up. Ferrari were leading the race after the start and therefore they were in good shape to win the race. Rosberg managed to undercut Räikkönen to claim second place, but soon afterwards the race was stopped to clear the debris of the Alonso-Gutiérrez accident. This presented the teams with the opportunity to make a free tire change. Mercedes decided to put Rosberg on the medium-compound tire, while Ferrari left Vettel on supersofts. After the restart Vettel was able to pull away slightly, but he soon started to lose time and his inevitable pitstop eventually dropped him behind even Hamilton's Mercedes.

In order to understand why Ferrari could make such a horrible error of judgement, it may be helpful to use some game theory. I assume that both teams have the same information about the tires, that is:
1) the medium-compound tire is slow, but will last the remainder of the race
2) the soft and supersoft tires are faster, but less durable, so they have to be replaced at some point

Ferrari had track position, Mercedes likely had speed. The ideal scenario for Ferrari would be to simply copy Mercedes' strategy. However, both teams had to choose their tires simultaneously, so Ferrari had to guess Mercedes' tire choice in order to make their choice. There were four different scenarios: both teams choosing mediums, both choosing the softs or supersofts (which are treated the same in this analysis) or both would choose a different compound (medium or non-medium). How would these choices work out?

If both were to choose the medium-compound tire, then Vettel would be reasonably safe. Overtaking a car on the same tires would be incredibly difficult and there were no more scheduled pitstops to spoil the party. If both drivers were to choose the softer tires, then there would be a possibility for Rosberg to undercut Vettel. The other possibility was for Rosberg to stay out longer so his fresher tires could help him to overtake. Still the chances of Ferrari to win the race would be very real, but it wouldn't be as easy as in the first case. Then the deviation strategies. If Rosberg were to pick the softer tires, he might have the possibility to overtake Vettel, build a lead and chase him again after the pitstop. It was a bit of a risk, but it might work. If Vettel were to pick the softer tires, he would certainly lose the lead due to the pitstop, but later he would possibly be able to regain the lost place on better tires.

Now the ideal strategies depend on the expected pay-off matrix below. The probability that Vettel wins in a particular scenario (left number) is always 1 minus the probability that Rosberg wins (right number), under the assumption that no strange things will happen.

Pay-off matrix.
In this case we assume that probability a is fairly high (for example: 90%). So if both drivers choose the medium-compound tire, then Vettel's chances to win the race are high (and Rosberg's are low). In case they both choose supersofts, then Vettel's chance c is still high, but not as high as in case they both choose mediums (c < a and c > 1-c). In case both drivers choose a different strategy the probability of the driver on the harder tire compound to win the race is higher (1-b > b).

If c > 1-b, there is no Nash equilibrium, as both teams have different interests (Ferrari wants both drivers to be on the same strategy, Mercedes wants to deviate). However, if 1-b > c, then there is a Nash equilibrium at (M,S), so Vettel would choose mediums and Rosberg would choose the softs or supersofts.

This is, however, completely the opposite of what really happened. The actual tire choice was very likely not a Nash equilibrium (if it was the probabilities would make no sense), which is puzzling. Ferrari's strategy wasn't "optimal", nor was Mercedes' response. If both teams had done the "right" thing, Vettel would have been on mediums and Rosberg would have been on softs or supersofts.

Possibly Mercedes played some good poker game and decided to do something unexpected in an attempt to outwit Ferrari, but it might also be that Ferrari out-thought themselves. Their line of reasoning might have been like this: "If Mercedes chooses the medium-compound tires, we will do likewise and we will win the race. So Mercedes will not choose the medium tires. In that case, it's safer to fit the softer tires as well."

This indicates that according to Ferrari c > 1-b (so if Mercedes were to choose the softer tires Ferrari's best response was to fit the softer tires as well) and therefore there was no Nash equilibrium. Ferrari then made the logical assumption that Mercedes wouldn't risk being on a dead strategy (both drivers on mediums) and go for a riskier strategy, which Ferrari then copied. They were wrong, because Mercedes went for the possible easy position gain in case Ferrari would have to stop again. They were proven right, but probably it was more luck than good judgement.

22 June 2016

Azerbaijan race analysis

The European Grand Prix wasn't the most spectacular race this season. The race was pretty straightforward, without major accidents or safety car periods. The Mercedes-powered cars enjoyed a significant advantage over their rivals, which enabled Rosberg to win the race easily, while Pérez took another well-deserved podium.

The teams without a Mercedes engine were struggling. The Renault factory team was even outpaced by the Mercedes-powered Manors in qualifying. The similarly disadvantaged Red Bull team did remarkably well in qualifying, but they were not nearly as good in the race. Just as in Canada their low-downforce setup caused them to eat their tires in the race; especially the softer compounds. They were, however, not the only ones.

In the race there were two groups of teams: the teams with tire problems and teams without. Unfortunately for the race, the top teams apparently had very little tire degradation, in contrast to the other teams. Apart from Mercedes, Ferrari and Force India only Bottas, Magnussen and Haryanto managed to finish the race on just one stop. Red Bull and McLaren were really struggling on the supersofts. Based on a laptime analysis with team-dependent tire wear, their degradation was over a second per lap, This explains why they pitted after just a handful of laps. While the McLarens were much happier on the softs, the Red Bulls only seemed to work on the mediums:

Tire wear on the supersofts with respect to tire wear on softs per team (red dots).
The supersoft tires were discarded early in the race, which makes those tires harder to analyze. Congestion and track evolution always decrease the accuracy of the laptime predictions of the first laps. To my surprise the analysis shows that the yellow soft tire was the tire with highest degradation and generally highest outright pace. This may be due to drivers nursing their supersofts to stretch their first stint, but as the leaders were really pushing to build a gap, that seems unlikely. On average, tire degradation on the softs was about 0.07 seconds per lap. The supersofts were slightly more durable with a tire degradation of 0.04 seconds per lap, while the mediums were, as expected, most durable with a tire degradation of only 0.03 seconds per lap.

Azerbaijan race - Driver by driver
Rosberg (1) was flying on supersofts (+0.6). His second stint was a bit inconsistent due to traffic, a wrong engine setting and no pressure from behind. Therefore, he was 0.4s slower than the fastest man on softs, which turned out to be Räikkönen.
Vettel (2) was slightly faster than Rosberg on softs (+0.3), but much slower on supersofts (+1.7). Due to the relatively high tire wear on the soft tires his decision to delay his pitstop was probably the right thing to do.
Pérez (3) was just incredibly fast on softs (+0.2s), but considerably slower on supersofts (+2.1s).
Räikkönen (4) was estimated to be the fastest driver on the race. On softs. On supersofts he was a massive 2.6 seconds slower, although this figure is not very reliable as he pitted early. Perhaps that early stop really cost him later in the race.
Hamilton (5) showed his true pace in a only few laps in the race, as he was in traffic on supersofts (+1.9) and in the wrong engine mode for most of his stint on softs (+0.9). In the last laps he wasn't even pushing as he felt he was too far behind. A horrible race.
Bottas (6) was still slightly slower than that at +2.2 on supersofts and +1.2 on softs. He had the highest top speeds of all, but unlike the Red Bulls his tire wear was pretty good. The pace just wasn't there, so possibly he had to drive very carefully to keep the tires alive.
Ricciardo (7) saw his supersofts drop off after just 3 laps, which resulted in a disappointing pace (+2.8). On the softs he wasn't too bad (+1.5), but still he had to switch to the mediums (+1.6).
Verstappen (8) was really struggling on the supersofts (+4.4). He was a little better on the softs (+1.8), but he really came alive on the mediums (+1.3).
Hülkenberg (9) was on the counter strategy, but it didn't really work out very well. His pace on softs wasn't particularly good (+2.1) and he was faster on supersofts (+1.7) until those tires hit the cliff.
Massa (10) had to convert to a 2-stopper, unlike his teammate. His tires gave up in the last stint and therefore he was unable to attack. On the soft tire his pace wasn't great (+1.7) and on the supersofts he was just slow (+3.1).
Button (11) was very slow on the supersofts (+3.9), but much better on the softs (+1.8).
Nasr (12) finally had a good race. His pace was a bit disappointing on the supersofts (+3.8). but he was much faster on softs (+1.9).
Grosjean (13) was one of the few drivers who used all three available tire compounds. He was quite fast on the softs (+1.6), alright on the mediums (+2.5), but quite bad on the supersofts (+3.2).
Magnussen (14) did a very long stint to recover from his pitlane start. He was at +1.9 on softs and +3.6 in his very short stint on supersofts.
Palmer (15) was also at +2.0 on softs and quite fast on supersofts (+2.7). Still he ended up behind his teammate.
Gutiérrez (16) was remarkably fast on the supersofts (+2.8) and alright on the softs (+1.8).
Ericsson (17) was too slow on softs (+2.8) and a bit better on supersofts +2.6 in his short middle stint.
Haryanto (18) pitted at the end of the first lap and managed to finish the race without stopping again. His tire wear wasn't that impressive, however. His pace on the softs was +3.2.
Sainz (retired) was fast on the supersofts (+2.2) and alright on softs (+1.6). Should have been fast enough for points.
Alonso (retired) was a bit better than Button on the supersofts (+3.0), but slower on the softs (+2.1). Was about to lose his position before the car broke down.
Wehrlein (retired) wasn't particularly fast in the race. +2.5 on the softs and +4.6 on the mediums as he started to experience brake problems.

14 June 2016

Canada race analysis

Usually the Canadian Grand Prix is one of the more exciting races on the calendar. The track is unforgiving, a likely safety car period could easily shuffle the field and this year a wet race seemed likely. Sadly, the expectations were not met, so the 2016 Canadian Grand Prix was rather dull and uneventful. To make matters worse, it was decided by another Ferrari goof-up.

Possibly Ferrari were keen to avoid a repetition of the 2012 Canadian Grand Prix, when Alonso (Ferrari) and Vettel were swamped by a recovering Hamilton at the end of the race. Alonso's tires then hit the cliff and he even dropped to fifth place at the finish. So when the opportunity was there, Ferrari decided to go for a 2-stop strategy. It meant that Vettel, who was leading the race, lost track position to Hamilton, from which he never recovered. Hamilton's tires lasted until the end of the race, so he won.

Although Hamilton might have won the race even if Ferrari had stuck to their planned 1-stop strategy, he at least had to work harder for it. Overtaking was still incredibly hard and due to the relatively low tire wear and temperatures, the undercut was not as powerful as usual. Therefore Ferrari would have had a chance to cover Hamilton's strategy and maintain track position.

Hamilton-Vettel race analysis
Unfortunately Ferrari went for a the more risky 2-stop strategy. Even though the virtual safety car reduced the time loss associated with a pitstop, the stop was too early to be really advantageous. The timing of Vettel's second stop was about right, so after that early stop there wasn't much more Ferrari could have done better. Hamilton, in the meantime, was saving his tires, as can be seen in the Race History Chart:

Race History Chart: the Hamilton-Vettel battle.
Until his stop, Hamilton's trace follows the predicted trace rather well, but after his stop he begins to drop back. Only after Vettel's second stop he begins to speed up, so Vettel couldn't really close up on him. Even though his tires were 13 laps fresher, Vettel could only gain a few tenths per lap at most. With his tire preservation Hamilton ensured that his tires wouldn't reach the cliff, so he could easily keep Vettel, who made a couple of errors himself, at bay.

Bottas wins battle for third place
The battle for third place was also decided by tire management. The Red Bulls couldn't make the tires last to do one stop, Rosberg, who dropped to tenth place at the start, got a puncture and had to pit again, while Räikkönen was on the same weird strategy as Vettel. This allowed Bottas to finish in third place. His tire management was brilliant, but different from Hamilton's tire preservation:

Race History Chart: battle for 3rd.
Thanks to a blindingly fast pitstop and a very constant pace, Bottas managed to climb from 7th to 3rd place in the race. He also benefited from the Red Bulls' tire mismanagement. After the virtual safety car Verstappen, who was saving fuel and tires, was told to speed up as Ricciardo was a little too close behind. He duly did and soon Ricciardo started to drop back. Verstappen's tires lasted a little longer, but he too had to pit early to keep track position over the incredibly slow Räikkönen. Ricciardo dropped behind the Finn and then compounded his misery by flatspotting his tires, so he had to pit again. Verstappen's initial pace on the softs was quite good, but he started to fade just when Bottas got in clean air. The Finn quickly reduced the gap and Red Bull had no option but to pit Verstappen. The team allegedly ran out of soft tires (every driver had two sets of softs for the race, because only the soft tire was the mandatory race tire, so the story doesn't really add up. Perhaps Red Bull couldn't find the second set of soft tires in time), so they fitted ultrasofts. The softest tires gave up the ghost just as Verstappen got Bottas in sight.

Rosberg was having another poor race. His progress in the race was way too slow given the outright speed of his Mercedes. Still he had a chance to get to the podium until he got a puncture, which dropped him behind Räikkönen and Ricciardo. He managed to pass both easily, but even with a huge DRS-induced straightline speed advantage he couldn't get past Verstappen, who was the only driver who defended the inside line at the long straight. Their hard-fought battle cost them precious time, which meant that Bottas was safe in third place. Verstappen's skillful defense earned him the "Driver of the Day" title, which wasn't really deserved. Based on their qualifying performance, Red Bull should have been 3rd and 4th instead of 4th and 7th, even though their race pace wasn't so good.

Pace analysis
The underlying pace of every driver can be derived from laptime data. Slow laps and laps in traffic are excluded and the laptimes are then corrected for fuel load and tire wear. The resulting variance in laptimes can then be attributed to the driver-car combination.

The analysis confirms that tire wear was not very high. The degradation on the ultrasoft tire was about 0.068 seconds per lap, which is equal to a more substantial 0.11 seconds on a standard 5.5 km circuit. The soft tire was twice as durable. Interestingly, it seems that only the top teams really managed to get some extra pace out of the ultrasoft tire:

Relative speed on the ultrasoft and soft tires.
According to the regression line, the top teams were about 0.5 seconds per lap faster on the ultrasofts, while the backmarkers were even slower on the ultrasofts. Possibly they couldn't get the tires in their operating window, which indicates that the purple tire is rubbish. The other possibility is that the analysis doesn't control well enough for traffic.

Underlying pace, team by team
We now go to the underlying pace of the drivers, relative to Vettel's pace on ultrasoft tires.

Ferrari
Contrasting performances by the Ferrari men. Vettel was quite fast, even though he got it wrong a few times in the chicane. His pace on the ultrasofts was the fastest of all. He was about 0.5 seconds per lap slower on supersofts and he was 0.7 seconds per lap slower on softs. Räikkönen was about equally slow on all tire compounds: 1.2 seconds on ultra- and supersofts and 1.3 seconds per lap on softs.

Mercedes
Hamilton's race seems to suggest that Mercedes was still a bit faster in the race, but not much. On the soft tires Hamilton was only 0.4 seconds per lap slower than Vettel on ultrasofts, which in combination with the low tire degradation explains why Vettel couldn't really attack him. However, on the supersoft tires he was 0.1 second per lap slower than the Ferrari driver. Even though he set the fastest lap of the race, Rosberg's pace wasn't really there and he almost ran out of fuel. On both compounds he was 0.9 seconds slower than Vettel on ultrasofts.

Williams
Bottas' tire management is reflected in his strong underlying pace. Bottas was the 3rd-fastest in the race: compared to Vettel on ultrasofts he was 0.6 seconds per lap slower on ultrasofts and 1.0 second on softs. Massa's pace is affected by overheating problems, so his underlying pace couldn't be determined.

Red Bull
The Red Bulls were rather slow in the race, possibly due to fuel consumption problems in addition to their tire wear issues. Ricciardo was slightly faster than Verstappen on ultrasofts (+0.8 versus +0.9 seconds), but Verstappen was considerably faster on softs: +1.1 versus +1.4 seconds per lap.

Force India
The funny thing about the Force India drivers is that they're so different and yet performing similarly. Hülkenberg qualified in the top 10 and was therefore on a standard 2-stop strategy. His pace on the ultrasofts was quite good (+1.3 seconds), but he was rather slow on the softs (+1.8 seconds). The opposite was true voor Pérez, who started the race on softs. He couldn't get heat into them and he couldn't make them last long enough to do a 1-stopper. Still, he was faster than Hülkenberg on the same tire (+1.4 seconds). His real problem was his middle stint on ultrasofts, on which he was 2.0 seconds slower than Vettel on the same tires.

Toro Rosso
A great recovery drive by Sainz, who started from the back and finished in between the Force Indias. His race pace was good enough to beat Hülkenberg without the qualifying incident, as his speed on the ultrasofts was quite good (+1.2 seconds) and his speed on the softs was also alright (+1.5 seconds). However, it was a lackluster performance by Kvyat, who somehow managed to finish behind his teammate, even though he started five places ahead of him. His pace on the ultrasofts was not very good (+1.7 seconds) and his performance on the softs wasn't stellar either (+1.9 seconds). He has to improve quickly if he wants to keep his seat.

McLaren
After a good qualifying the McLarens suffered from high fuel consumption in the race. Button had to retire early on when the Honda consumed itself. Alonso was on a very conservative 1-stop strategy in a bid to reduce fuel consumption. He managed the tires really well and in the final laps he was allowed to turn up the wick to overtake Kvyat. His pace was rather disappointing: +1.8 on ultrasofts and +2.0 on softs.

Haas
A weekend to forget for the Hare team. Grosjean was faster in the race until his front wing broke. Gutiérrez was ill and got slower as the race progressed. According to the analysis they were equally fast on supersofts (+2.0 seconds; this result can be taken with a grain of salt as Grosjean passed Gutiérrez early in the race), but Grosjean was faster on softs: +1.9 versus +2.4 seconds.

Renault
Another weekend to forget for the French team. Both cars were miles off the pace. Magnussen wrecked his car in free practice and had to start from the back. He used a 1-stop strategy to finish ahead of the Manors and Nasr's Sauber. His pace on both compounds was over 2.5 seconds slower than Vettel's pace on ultrasofts. Palmer was one of the few retirements in the race.

Sauber
Despite a grid penalty for taking out his teammate in Monaco, Ericsson delivered his usual solid performance to finish in 15th place. He managed to beat Magnussen, even though he was slower on the ultrsofts (+2.8 seconds). He was, however, slightly faster on the soft tires (+2.5 seconds). Nasr was rear-ended by Magnussen in the first lap, which didn't do his race any good, but his pace was horrible: +3.7 seconds on ultrasofts and +2.8 seconds on softs.

Manor
Another encouraging weekend for the Manor team. Wehrlein was again able to fight the Saubers and Renaults, but due to worse tire management he could only keep Nasr and his teammate behind. He was slightly faster on the ultrasofts than on the softs: +2.6 versus +2.7 seconds per lap. Haryanto lost a lot of time due to blue flags. His pace on the ultrasoft tire was not so bad (+2.9 seconds), but his pace on the soft tire was (+3.4 seconds).

18 May 2016

Spain race analysis

So far the 2016 F1 season has been great. Thanks to the new tire rules the races have been very interesting, if not a bit chaotic: in the first five races of the season overtaking has been more common than in 2011, the first year of DRS and Pirelli tires. The only thing missing was a real battle for the lead, as Rosberg had won four races without too much difficulty. If he'd selected the right engine mode at the start of the Spanish Grand Prix, he might have had another uncontested race win. Luckily for the spectators he didn't and therefore we could witness a cool battle for the lead instead of third place, resulting in a shock win.

After the Mercedes' had gone out, we were left with a battle between the Red Bulls and the Ferraris. The Ferraris had been fast all weekend, except for qualifying, and therefore they had to do some overtaking work in the race. They failed to make progress at the start. Vettel managed to get past Verstappen, but he was immediately re-passed in turn 3. Even worse, he was also passed by Sainz. Both Vettel and Räikkönen managed to get past the Toro Rosso after the re-start, but they had lost valuable seconds in the meantime. In clean air, however, they were considerably faster than the Red Bulls, who soon pitted. After the stops the top 3 was covered by only a few seconds. As the track is one of the most difficult tracks for overtaking, Ferrari had to come up with some creative strategy to defeat the Red Bulls.

The strategic possibilities were, however, limited. The tire allocation for the Spanish Grand Prix was soft, medium, hard. The hard tire was clearly the most unpopular tire; only the Renault team used it in the race. Therefore only the softs and mediums were a viable option in the race. In the top 10, all drivers started the race with 3 sets softs (used in qualifying), 2 sets of fresh mediums and 1 set of useless hards. This limited the strategic freedom further, as a 3-stop strategy had to use the soft tires in at least 2 stints.

Laptime analysis* reveals that the medium tire was, on average, the best tire in the race. Fresh softs were over a second per lap faster, but as the leaders only had used softs left, the grip advantage of the softs was only about a second. The soft tires wore out over two times as fast as the mediums: the tire degradation of the soft tires was about 0.22 seconds per lap, while the medium tires wore out at a rate of almost 0.10 seconds per lap. This led to a crossover point at 8.5 laps, suggesting that the medium tire was superior over the soft tire in stints longer than 17 laps. Given that the average stint length of a 2-stopper was 21 laps (the race essentially lasted 63 laps), the medium tire was the preferred tire.

Optimal strategy
2-stops: 15 laps on softs, two stints of 24 laps on mediums
3-stops: two stints of 13 laps on softs, two stints of 18-19 laps on mediums

Interestingly enough, the optimal 3-stop strategy would gain 21.6 seconds on track compared to the optimal 2-stop strategy. The pitlane losses were estimated to be about 21.5 seconds on average, so in theory both strategies were equally fast. Traffic would make the difference. Generally, a more aggressive strategy induces more traffic, but that's not always true. Employing a different strategy can be a great tool to get out of traffic. For some reason Ferrari didn't pit Vettel when he was close to the Red Bulls at around lap 25. This gave Red Bull the opportunity to pit Ricciardo on lap 28 to avoid the Ferrari undercut. Ferrari reacted and pitted Vettel in the next lap, which meant that he was still behind Ricciardo. Both drivers were now on a 3-stop strategy.

Meanwhile Red Bull left Verstappen out to cover a potential 2-stop strategy from Räikkönen. As it turned out, Räikkönen was indeed on a 2-stop strategy. Again, Red Bull pitted their driver one lap before the Ferrari driver. Interestingly, Vettel pitted just a few laps later in order to undercut Ricciardo. Red Bull left him out for quite some time so he would have a decent tire advantage at the end of the race.

After the final pitstops Verstappen was leading the race, with Räikkönen right behind him. Vettel and Ricciardo also had fresher tires, so a 4-way battle for the lead seemed likely. However, overtaking was still very hard, as Räikkönen found out. He couldn't get within 0.6 seconds in the last corner and that just wasn't close enough. Verstappen managed to stay ahead by a few tenths of a second at the end of the straight (about 20 meters), while Räikkönen was closing in at a rate of 25 km/h (about 7 meters per second) due to the slipstream and DRS. Behind them, Ricciardo was able to get a little closer to Vettel in the last corner, but the Ferrari engine was powerful enough for the 4-times world champion to stay ahead.

The final laps were nail-biting, but in the end, except for Ricciardo's desperate "dive bombs" and his flat tire, nothing much happened. Vettel couldn't close the gap to his teammate, who couldn't get past the Red Bull. So in the end Verstappen won the race, ahead of Räikkönen. The "first drivers" Ricciardo and Vettel lost out with their more aggressive strategy, as they couldn't regain the lost time in the pits. The next figure summarizes the race:

Race History Chart of the 4 front-runners.
The "trails" based on laptime analysis fit reasonably well:

Race History Chart and projections.
Räikkönen especially lost a lot of time in the first stint, when he was being held up by Sainz. Once in clean air he was very fast. In fact, he was the fastest driver in the race by a clear margin (almost 0.4 seconds per lap).** Vettel, however, was fast at the beginning of the race, but slower at the end of the race. He complained about his performance on the medium tires. His last stint was quite disappointing indeed, as he wasn't able to close the gap to the leader faster than he did. It also shows that his very short third stint on softs really hurt him. The Red Bulls seemed to perform better on the medium tires. Verstappen's final stint suggests that he might in fact have been faster than Ricciardo in the race, as his trail is well ahead of the projected line. However, in the final 10-15 laps he started to suffer from additional tire degradation, which slowed him down significantly.

According to the analysis, Räikkönen had the pace to win the race. If it wasn't for traffic he would have won the race by about 25 seconds, which really shows the importance of a good qualifying. Even from where he started, the predicted line shows that if he had been able to overtake Verstappen early in the last stint, he would still have been about 10 seconds ahead at the end of the race. Ricciardo's strategy was in theory good enough for second place, while Vettel was never going to beat Verstappen.

Predicted Race History Chart.
Räikkönen was almost half a second faster than Verstappen in the final stint. As it turned out, it just wasn't enough to overtake, as Verstappen didn't make any mistakes. In hindsight, if Ferrari had pitted Räikkönen a few laps later, he might have had a big enough speed advantage to overtake. The same applies to Ricciardo, who might have had a better race if Red Bull had delayed his final stop a bit more. It also would have prevented him from getting a flat tire in the penultimate lap...

Anyway, it was a thrilling race with a new winner. Thank you Mercedes!

* Only laps in clean air (more than 2 seconds behind another car) are used. Extremely slow laptimes are excluded.

** Driver speed:
1. Räikkönen
2. Vettel +0.35
3. Verstappen +0.36
4. Ricciardo +0.36
5. Bottas +0.99
6. Massa +1.08
7. Sainz +1.26
8. Gutiérrez +1.48
9. Pérez +1.48
10. Grosjean +1.53
11. Kvyat +1.55
12. Button +1.68
13. Alonso +1.79
14. Palmer +1.94
15. Ericsson +2.03
16. Magnussen +2.22
17. Nasr +2.28
18. Wehrlein +2.71
19. Haryanto +2.78

Hülkenberg and the Mercedes drivers had no (uncongested) laps. The typical margin of error of the estimates is 0.1 seconds.

05 April 2016

Bahrain race analysis

What a difference a rule change can make! The new tire rules are quite hard to understand, but so far they've managed to make the races much more interesting and much less predictable. The presence of a third tire compound has increased the strategic possibilities by an incredible amount and therefore the teams can easily go wrong. Due to the increased grid and more competitive cars compared to last year, the number of overtakes has doubled and after five years of gradual decline overtaking is at its record-breaking 2011 level. For the moment at least.

The 2016 tire rules give the teams the option to use the softest-compound qualifying tire in the race. Although the harder-compound tires are naturally more suitable for the race, they may even lose out to an aggressive soft-tire strategy in the race. However, there is usually not much in between the different strategies, so the compound choice is also determined by the circumstances. For example, in Melbourne many teams chose to run the hardest tire (the medium tire) after the red flag in order to finish the race without further pitstops. Although the more aggressive strategies may have been faster, they also require some overtaking on a track where overtaking is quite difficult.

In Bahrain, one of the first Tilke tracks, overtaking is not so much of a problem. Despite that, we saw a lot of different strategies in the very crowded midfield. Sadly, the battle for the lead was over after the first corner, when Bottas T-boned Hamilton. With a damaged car Hamilton could only manage 3rd, behind Rosberg and Räikkönen. Rosberg was leading by 15 seconds before the first pitstops and from then on he was managing the gap to Räikkönen, so after two races we still don't know how fast the Ferrari is compared to the Mercedes.

More interesting was the battle behind the Mercedes and Ferrari. Ricciardo, Grosjean and Verstappen were the only other drivers to finish in the same lap as the winners, while the Williamses slipped back from 2nd and 3rd after the first corner to only 8th and 9th at the finish. What went wrong? Was it a matter of a poor strategy or were they just not fast enough?

Laptime analysis
Laptimes in the race are determined by many different factors. In this analysis, I've tried to separate the strategic factors, like tires and tire wear, from the intrinsic driver speed. This should give the natural finishing order in case of equal strategies and no further delays (traffic) during the race. The tire-wear data can then be used to evaluate the chosen tire strategies. In the analysis the laps in traffic are automatically excluded, so they don't disturb the results.

Driver speed
The fastest drivers in the race were Rosberg and Räikkönen, who were equally fast. Hamilton was almost half a second slower, but it was claimed that the damage to his car cost him about a second per lap. This suggests that either Hamilton is half a second faster than Rosberg, or that Mercedes has still some pace in hand.

Despite finishing over a minute behind, Ricciardo was 4th-fastest in the race. His intrinsic pace was 0.9 seconds per lap slower than Rosberg's, which accounts for about 50 seconds of his deficit at the finish. The other ten or so seconds were lost in traffic. Verstappen and Grosjean were fifth and sixth pace-wise, but they were almost 0.5 seconds per lap slower that Ricciardo. For Grosjean it was even more impressive to finish where he did, given that he lost quite some time in the pits. Apparently he regained some time with his hyper-aggressive tire strategy. Only slightly slower was Bottas, which suggests that without the drive-through penalty he may have been able to hold on to fifth place. His teammate Massa was 0.2 seconds per lap slower, but he was still a tenth of a second faster than Kvyat, who passed him in the penultimate lap.

Strategy
In the race, fuel and tires have a profound influence on laptimes. The fuel load slowly burns off during the race and is assumed to behave the same for all cars. Yet, I was surprised that the effect was 0.07 seconds per lap. It may not seem much, but it means that the laptimes improve by about 4 seconds during the race and that's quite a lot in this turbo era, as the amount of fuel is limited to 100 kilograms for the entire race. Typical laptime improvements are 0.05 seconds per lap on medium-length tracks nowadays. Possibly the figure is inflated by the track improving during the race (rubbering in or maybe the sand got removed during the race). Anyway, the fuel load is the most noticeable signal in the data. Tire wear was high, which is not surprising. Last year, the race was a boring 2-stopper, with most drivers using two sets of soft tires and one of the medium tires. This year, the supersoft tire was available for the race, with great grip (Hamilton set a lap record in qualifying) and huge tire wear.

Based on the average of all drivers, tire wear was nearly 0.16 seconds per lap on the mediums, 0.23 seconds per laps on the softs and a staggering 0.27 seconds per lap on supersofts. The supersofts were, of course, considerably faster: they were 0.4 seconds per lap faster than the softs and 1.1 seconds per lap faster than the medium tires. Still, in the longer runs the tire compounds were performing similarly and therefore there was quite some strategic variation.

Suppose there are thee equally skilled drivers: Red, Yellow and White. Red can only use the supersoft tires in the race, Yellow only the softs and White only the mediums. Who would win? Based on the tire-wear data, Red would win, but only by 6 seconds. White is a further 7 seconds behind, but he only needs 2 stops instead of 3, which may prove a strategic advantage. So the medium tire was still slower in race-trim, but traffic or exceptionally high tire wear could easily tip the balance towards the medium tire.

The midfield battle
Let's return to the battle for 4th to 8th. All drivers were on different tire strategies: Massa was the only driver on a 2-stop strategy, while the other drivers made 3 stops and were running softer tires. Let's see how their races panned out:

Race History Chart of the midfield battle compared to Ricciardo's average pace.
Massa's race started promising, but at his first stop he switched to mediums and he got passed by Ricciardo, Grosjean and Verstappen on the softer tires. After the final round of pitstops he was still ahead of Grosjean and Verstappen, but they passed him easily on much fresher tires. Even Kvyat, who had to recover from a poor grid position, managed to pass him. Interestingly, Massa's Race History Chart is quite close to the predicted (dashed) curves, which suggests that his race was relatively problem and error-free.

Race History Chart and traces of Ricciardo, Grosjean and Massa.
Massa's first stint on the medium tires was quite poor. His pace was quite good for a few laps, but then he drops back significantly, so he crosses the predicted line at around lap 16. He regains some time due to a very good pitstop and in his last stint his pace is even slightly better than expected; his tire wear looks pretty good. The exact opposite applies to Grosjean, who lost quite some time in the pits, especially at his last stop. Without the delay he would have been very close to Ricciardo, who finished the race on mediums, but due to the higher tire wear of his soft tires he would have to give up the chase anyway. Ricciardo's race was pretty much as expected.

Could Massa have done better with a different strategy? Probably. Due to the high tire wear a 2-stop strategy with just a 7-lap first stint would always be a tall order. Of course Williams had to stop Massa early if they wanted to maintain track position over Ricciardo, but it meant that Massa had to do 50 laps on just two sets of the slowest tire. If he had been patient enough to stop as late as lap 16, then he would have saved 15 seconds in the race, which would still just have been enough for 7th place. With that early pitstop the best strategy was probably to do a 3-stopper on the soft tires, which would have been about as fast as the optimal 2-stop strategy. Without the drive-though penalty 5th (Bottas) and 8th (Massa) was the maximum possible for Williams, which would have been the same result as in Melbourne. Williams is just not very quick in 2016. Mercedes and Ferrari are clearly ahead and Red Bull, Toro Rosso and Haas seem to have a better race pace too.

19 December 2015

The secret of a good race

When is a Formula 1 race a good race? A lot of overtaking and a nice battle for the lead are generally appreciated, but what other factors do play a role?

Although qualitative labels like “good” or “bad” are highly subjective, they can be made a lot more objective if they are collected in a large-scale survey. For this I’ve used the rate-the-race results from F1 Fanatic. This wonderful site allows readers to give their verdict on the races from 2008 onwards and with about 600 votes per race the average ratings should be quite accurate. The ratings vary strongly from race to race, but the season averages show that some seasons were rated higher than others. The average rating of the best season was more than one point higher than the average rating of the worst season (7.37 to 6.32 on a scale from 1 to 10).

Average race ratings from 2008 to now.
It’s interesting to determine the root cause of these per-season differences and therefore I’ve analyzed the ratings of the individual races. There are many factors that will affect the race ratings. I came up with these factors:
• Number of overtakes
• Number of retirements
• Track
• Weather conditions
• World Championship situation
• Whether or not there is a battle for the lead
• Whether or not the winner is the same as the previous race

Most of this data is easy to obtain, except for the overtaking data. The per-season averages can be found at Clip the Apex, while the figures per race are only available for members. So let’s first focus on the season averages.

Average number of overtakes per race per season from 2008 to now.
Clip the Apex shows the average number of overtakes per season for all races (blue) and the dry races only (orange). The number of overtakes increased substantially with the introduction of DRS and Pirelli tires in 2011, but since then the number of overtakes has decreased again. Indeed there is some correlation between the per-season number of overtakes and the average race ratings, but it’s clear that more factors play a role.

Retirements per race per season from 2008 to now.
Retirements add unpredictability and are therefore likely to raise the race rating. The reliability of the cars shows, however, a fairly predictable pattern: the number of retirements generally decreases, except for 2010 (3 new and inexperienced teams) and 2014 (complex hybrid turbo engines).

Frequency of races on Tilke tracks from 2008 to now.
The so-called “Tilkedromes” are not really liked by the fans, as they share common traits like long straights and a lot of boring constant-radius corners. However, the frequency of Tilkedromes races per season has remained more or less constant during the test period.

Frequency of wet and variable weather races from 2008 to now.
Although the weather should be pretty much random (this timescale is not long enough for climate change to play a role), the graph shows a clear trend. 2008 had by far the most wet (dark blue) races and a substantial amount of partly wet races (blue), while the fateful 2014 Japanese Grand Prix was the only wet race of the last 5 seasons. As wet races induce more unpredictability, they are usually rated higher.

Average championship lead in wins from 2008 to now.
If one driver dominates the championship, viewers may lose interest in the race. In the recent years, 2011 saw the biggest dominance by one driver, when Vettel led the championship from the first race. In 2008 (with Hamilton only winning the title in the last corner), 2010 (four title contenders in the last race) and 2012 (where Vettel won the title from a seemingly hopeless position) the championship was much tighter and more interesting, which may have led to higher race ratings.

Frequency of back-to-back wins from 2008 to now.
A bit correlated to the championship lead is the back-to-back wins frequency. However, there is a difference between seasons when only one driver dominates the season (Vettel in 2011 and 2013) or when one team dominates the season (2014 and 2015). While both cases result in many back-to-back wins, the championship lead is of course much bigger in the former case. The frequency of back-to-back wins shows how predictable the championship is. Indeed, the unpredictable 2012 season (with 7 different winners in the first 7 races) has the lowest percentage (15%) of back-to-back wins.

Frequency of races with a battle for the lead from 2008 to now.
Another important factor is whether or not there was a fight for the lead, which I define as whether or not there was a pass for the lead. Fights for the lead have always been rare in modern Formula 1, but the introduction of DRS has increased this frequency. This year, however, only in the US Grand Prix there was a genuine fight for the lead, as in Malaysia and Bahrain there was a pass for the lead because of different strategies.

Analysis
So now it’s time to estimate the combined effect of the different factors on the race rating. I’ve done several analyses in order to obtain robust results. First, I’ve tested the influence of overtaking on the race rating. As overtaking has become much easier because of DRS, it makes sense to distinguish between the number of overtakes between non-DRS and DRS years. It appears that every overtake in the non-DRS years added 0.030 points to the race rating, while in the DRS years this value was “only” 0.021 points. However, this reduction may well be caused by the higher number of overtakes in the DRS years, which may decrease the additional value of one extra overtake. In order to circumvent this problem, I’ve used the logarithm of the number of overtakes. In this case, the coefficient for the DRS years in actually higher than for the non-DRS years, which suggests that overtaking actually has become more important.

The estimated effect of the number of overtakes on the race rating with and without DRS.
The difference between the estimated coefficients is, however, not statistically significant and as there is no good reason why the DRS coefficient should be higher, I chose not to distinguish between the non-DRS and DRS years. The average effect of the logarithm of the number of overtakes on the race rating is 0.810, which means that an increase from 1 to 10 overtakes increases the race rating by almost 1.9 points (races with no overtakes cannot be analyzed in this way, but there is only one race without overtakes in the dataset), while 40 overtakes boost the rating by about 3 points.

Other factors
The analysis clearly shows that unpredictability and uncertainty in appreciated. A battle for the lead is rewarded with 0.7-0.8 points, while the ratings drop by about half a point when the championship is decided. The championship decider is generally awarded with half a point, though. Back-to-back wins cost about 0.3 points, but every car that retires boosts the race rating by 0.14 points.

The tracks are a bit difficult to control for. Firstly, I distinguished between Tilke and non-Tilke tracks. Tilke tracks do 0.3 points worse on average. When controlling for all individual tracks, the results are similar. The most notable change is that overtaking becomes more important (the coefficient increases to 0.9), which probably means that tracks where overtaking is difficult have intrinsically higher ratings than overtaking-friendly tracks.

Wet races are usually rated quite highly. Variable weather increases the race rating by 0.8-0.9 points on average and wet races add 0.6-0.8 points.

Improving the sport?
Since 2009, Formula 1 has tried to improve the show. The return of slick tires in 2009 was one step, but the most important changes where the introduction of DRS and rapidly-degrading tires in 2011. Did they improve the show? According to the race ratings, they did, but how would every season be rated if all factors (number of overtakes, championship situation, reliability, weather…) had been equal? Interestingly, it seems that 2009, the season with the lowest actual ratings, is the clear winner, followed by 2008.

Average race ratings per year the individual contributions of the most important factors.
Due to a lack of overtakes (yellow), a relatively boring championship (grey) and relatively few wet races (light blue) 2009 was not rated very highly, but apparently its structural rating was quite high. This may have to do with the extreme competitiveness of the field (as Luca Badoer found out when he replaced Massa at Ferrari). Also, compared to 2008, there were fewer weird green-table decisions. The structural values also suggest that 2010 was not as good as many people make out, possibly because the refueling ban tended to make the races more predictable, or because the reduced competitiveness of the field. The drop of the structural value was compensated by an increase in the number of overtakes and the number of retirements, though. Since 2010 the structural rating has been quite low, but interestingly, the introduction of DRS in 2011 (easy overtakes) and the change to hybrid turbo engines in 2014 (lack of noise) have not influenced the structural value a lot, even though many fans didn’t like those changes. Interestingly, the championship situation, battles for the lead and weather conditions only explain a small part of the race ratings. Tilke tracks (grey), teamorders, prematurely red flagged races and races started from behind the safety car (red) had a negative influence on the race rating.

So it seems that the secret of a good race is a nice track, a battle for the lead, variable weather, a lot of overtakes, retirements, no back-to-back winners, and, if possible, the race should also be a championship decider. This sums up the 2012 Brazilian Grand Prix.

08 December 2015

It's the engine, stupid!

Even though Mercedes were dominating the 2014 season, there was some hope that the other teams would catch up in 2015. Williams, for example, were very strong at the end of 2014 and Red Bull were likely to perform better in 2015 with an upgraded Renault engine, so the future looked promising. In the end these predictions did not materialize and Mercedes were dominating again in the 2015 season, which was a big disappointment. Where did it all go wrong and why did Ferrari suddenly become Mercedes's closest rivals?

In 2014 Mercedes had by far the best car-engine combination. Williams had more or less the same engine, but a relatively poor chassis, while Red Bull had possibly the best chassis, but a much weaker engine. Apparently, neither Williams, nor Renault managed to make much progress over the winter, which left a much improved Ferrari as the only real threat for Mercedes, even though they still lacked a considerable amount of single-lap pace.

Although Ferrari had improved on all areas, only the improvements on the powerunit really stood out. In fact, the Ferrari chassis was even worse compared to Mercedes's in 2015, as an analysis on pure relative pace (based on the fastest lap by every team) shows.

I've used the relative pace of the teams (except Caterham, which was not included in the dataset and Manor for various reasons) for all races in the past two seasons. As the pace is relative to the fastest time, I think it makes sense to compare the pace to the mean pace-deficit of the field. In this way the relative performance of the frontrunners can be estimated. I've removed the outliers in the data and then I've correlated these relative performances to track characteristics.

Track characteristics:
  • Number of corners per kilometer to test the performance of the car's chassis
  • Percentage full throttle to test the performance of the engine
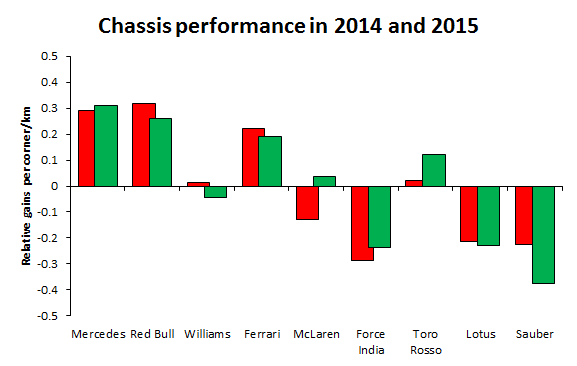
I've estimated the relative performance of each chassis and each engine for both seasons. These were the results:

Chassis performance in 2014 (red) and 2015 (green).
Engine performance in 2014 (red) and 2015 (green).
The chassis performance indicates how much the relative performance of a car improves with the number of corners per kilometer (which ranges from 1.9 in Monza to 5.7 in Monaco). As expected, Mercedes and Red Bull have the highest chassis performance (around 0.3% per corner per kilometer), followed by Ferrari. The chassis performances did not change too much between 2014 and 2015. The weaker teams did not really catch up. Only McLaren (different design philosophy), Force India and Toro Rosso managed to slightly improve their chassis compared to Mercedes. Mercedes's closest contenders actually all dropped back.

Interestingly, the Mercedes engine had on average the same edge over its rivals in 2015 as in 2014, as the engine performance shows. Their relative advantage was about 0.01% per percentage full throttle per lap (which is between 34 and 76%). Ferrari, however, made huge gains (which probably explains why Sauber did much better in 2015, as their chassis performance was still quite bad), while Renault was even less competitive than in 2014.

The combined effect of chassis and engine performance meant that Williams and Red Bull dropped away compared to Mercedes, as their loss of chassis performance was not compensated by a gain in engine performance. Ferrari, however, were the only of the three teams to gain a lot of horsepower, which meant that the prancing horse was the only top team to gain on Mercedes. This is clearly visible when the estimated average relative performances of 2014 and 2015 are plotted against each other:

The team average performance-level in 2014 and 2015.
On an average circuit Mercedes were 1.5% faster than the average car in both seasons, while Ferrari improved from 0.4 to 0.9%. Williams dropped from nearly 0.6% to nearly 0.4%, while Red Bull went from 0.6% to 0.2%. The other teams were quite consistent, and their relative performances did not change more than 0.2% from one year to another. Lotus and McLaren were, however, the exceptions. That was no coincidence, as they were the only teams to switch engine supplier. Lotus switched from Renault to Mercedes and benefited, while McLaren switched from Mercedes to Honda and instantly became a backmarker. With the aerodynamic development going relatively slowly, a good powerunit is more important than ever.

05 December 2015

2015: the true standings

The 2015 season probably was not the most exciting F1 season in history. One important reason was Hamilton's dominance in the first part of the season, which enabled him to decide the championship fairly early in the season. He was, however, also helped by Rosberg's misfortune. Could Rosberg have threatened Hamilton without his bad luck? And how would other drivers have performed without luck intervening? Let's find out!*

Australia
A race to forget as only 13 cars survived the first lap, while two more cars retired shortly after their pitstops. Räikkönen lost a likely 5th place, which drops Nasr and Ricciardo to 6th and 7th. The Toro Rossos of Sainz and Verstappen would have been 8th and 9th without a lengthy pitstop (Sainz) or a blown engine (Verstappen). Hülkenberg would then drop back to 10th place and Ericsson and Pérez would have dropped out of the points.

Malaysia
An interesting, yet rather straightforward race, with only a few mutations outside the points, where Button and Maldonado were on their way to finish in 12th and 13th place.

China
A much more difficult race. Maldonado was ahead of Grosjean when his brakes started to fail, so let's give him 7th place. Verstappen retired at the end of the race in 8th place, so let's give him 9th place (as Maldonado would still be ahead of him). Hülkenberg and Kvyat had to retire early in the race, but they were unlikely to score points anyway. Sainz lost some time due to a gearbox glitch, but it did not significantly affect his final position.

Bahrain
The first race in the season with some true battles at the front. Rosberg lost 2nd place to Räikkönen in the penultimate lap due to a brake problem, but Räikkönen was faster than him anyway, so this is a tough call. Let's assume for simplicity sake that Rosberg's problem didn't affect the final result. Ericsson lost a lot of time in the pits. His pace appeared to be good enough to beat the Pérez-Kvyat-Massa tussle, so an 8th place went begging. Maldonado also lost a lot of time during his last pitstop, but as he received a 5-second time penalty, he was likely to be classified behind Massa (who would have finished 11th) anyway.

Spain
A weird accident caused Maldonado to make another stop, which dropped him out of contention. He was 7th after a very strong opening phase and he may very well have finished there. Alonso was the other retirement, but he only lost a 14th place.

Monaco
Hamilton deserved to win this race, even though he was partly to blame for the decision to make that fateful second pitstop. In the midfield there were more unhappy drivers. Maldonado retired early in the race with yet again a brake failure. There is not enough data to determine his race pace, but given the impossibility of overtaking in Monaco, even with a disappointing pace he could have finished 8th. Verstappen would (at least) have finished in 9th place without his 30-second stop (and subsequent crash), while Alonso would likely have finished in 11th place behind Button.

Canada
Only some mutations at the back, where Merhi and the McLaren drivers retired towards the end of the race.

Austria
A bad pitstop cost Vettel 3rd place. Grosjean was on his way to at least a 9th place. Sainz, however, was unlikely to finish in the points.

United Kingdom
Ricciardo was just ahead of Sainz, who was in 9th place after the pitstops, so they would likely have finished in 9th and 10th position, barring mistakes when the rain came down.

Hungary
Räikkönen was the biggest victim of this chaotic race, as he lost an almost certain 2nd place. Rosberg and Ricciardo then had a race incident, which cost them 3rd and 4th place. Hamilton was perhaps a bit more to blame in his accident with Ricciardo and without the lost time in the pits he would have been 5th. Bottas also suffered a flat tire, which then cost him a 6th place. This then drops Kvyat to 7th and Verstappen to 8th place, while Sainz was good enough to claim 9th place without his issues. Alonso's strong drive should have earned him only one point.

Belgium
Vettel was on his way to 3rd place when his tire blew unexpectedly in the penultimate lap. Ricciardo then lost a 5th place when his car died in the Busstop Chicane, while Bottas lost a 6th place because of a weird tire mix-up.

Italy
Rosberg lost a 3rd place when his "old" engine finally gave up.

Singapore
Kvyat was hugely unlucky with the pitstops. He should have been 4th. Without his problems Hamilton would then have been 5th. Hülkenberg and Massa would have been 8th and 9th had they not collided.

Japan
Not much to say. Sainz was driving well until he damaged his front wing after a very late call, which cost him a 9th place.

Russia
Rosberg retired early in the race. which cost him a likely win. Bottas and Räikkönen then lost fourth and fifth place when Räikkönen crashed into his compatriot in the last lap. Ricciardo and Sainz were on their way to 7th and 8th place until their cars gave up the ghost in the final stages of the race.

United States
Many drivers eliminated themselves in the damp conditions at the beginning of the race. Hülkenberg was a bit unlucky when he crashed into Ricciardo after a front-wing failure, which cost him a 5th place. Alonso was unlucky at the start, but he was lucky with the safety cars. Without engine problems he may have finished in 6th place ahead of Pérez.

Mexico
Vettel was unlucky at the start, otherwise he was likely to finish in 3rd place. Räikkönen was a bit unlucky when Bottas ran into him as a retribution for what happened in Russia, but his pace was disappointing anyway.

Brazil
Nothing much happened. As he was quite slow compared to his teammate, it seems that Massa did not really benefit from his under-inflated tires, so let's give him that 8th place back.

Abu Dhabi
Kvyat lost engine power towards the end of the race, which cost him two places. Bottas was 10th before he ran into the back of Button in the pits, so let's give him 10th place.

Conclusion
Due to reliability problems and collisions there is a tendency for points to flow from the front to the back of the grid. This season Rosberg was the biggest net loser. He scored 40 points less than in the ideal-world situation. The Ferrari drivers lost 27 points each, while Hamilton only lost 15 points. The difference in lost points between the Mercedes drivers was not nearly enough for Rosberg to claim the title, but the gap would at least have shrunk from 59 to 34 points, enough to make the championship battle go on for two more races.

Points scored per driver and the ideal-world scenario.
The ideal-world scenario allows us to more accurately determine the relative strength of the drivers. The Williams drivers, for example, were seemingly very close (Bottas scored 136 points, Massa 121), but as Bottas lost 16 points due to bad luck, while Massa gained 21, the true difference should have been a much more substantial 52 points. Although he was outscored by his teammate, Ricciardo was the better Red Bull driver, as he lost a couple of points, while Kvyat was one of the biggest net gainers. Also Hülkenberg should have outscored Pérez, while Maldonado was much closer to Grosjean than the standings would suggest.

The team scores show that the top teams lost some and that these points were gained by the midfield teams like Force India (+27) and Red Bull (+20). Sauber (+22) made the highest relative gains, which suggests that the team really had to depend on other teams' misfortune to score points. The high relative gains of the weaker teams is illustrated in the graph below, which uses a logarithmic scale to highlight relative gains.

Actual points and ideal-world points per team on a logarithmic scale.
McLaren (grey-black) and Sauber (yellow-blue) scored well above their ideal-world points, the relative gains and losses were much less for the other teams. Ferrari (red) and Mercedes (grey) were the only net losers.

* I try to correct only for factors that are outside the drivers' control, like mechanical problems, botched pitstops and unforeseen consequences of wheel-to-wheel battles. Note that this is no rocket science. I only try to establish the true potential of all drivers.